Seven Ideas for Sustainable Living from the City of Sydney’s Data Slam
Better living through technology is the mission for hackers and designers mining city data feeds.
A few weeks back, the City of Sydney got together with Carbon Arts to run the City Data Slam. It was essentially a directed hackathon for Sensing Sydney, which takes the data the City uses to try to meet its sustainability goals and makes it interesting. Over a three-day weekend, invited artists, coders and some ISEA guests tried to find new information buried in this city data and ways to explain it. On the Sunday, each of the teams presented their solutions and Concrete Playground went along to check out some of the ideas.

Data'll Be All
Making sense of complicated numbers is a problem we've been struggling with for decades, and you've probably got the results of previous attempts on your phone. Whether you've personally been trying to make sense of big space numbers, powers of ten, two hundreds years of development or just trying to sort your tax, you've been working the problem. And there's stuff hidden in there. XML data, web publishing and mp3s weren't obvious candidates to revolutionise radio until they added up to podcasts, nor combining the tech in Gmail and word processing to make something like Google Docs. Equally, who knows what City data — like waste, water use or cycling sensors — could add up to in the right combinations?
Sustainability and climate change are two of the City of Sydney's big focuses in interpreting their data, and they're also, as Carbon Arts founder Jodi Newcombe says "often identified as 'wicked problems' or 'very wicked problems'. And those are [problems] characterised by the fact that people who are trying to solve them are also creating the problem as well." The visualisations and ideas from the Slam are meant to give individuals a way of finding a little leverage into these wicked problems.

Lycra Forecast: Low
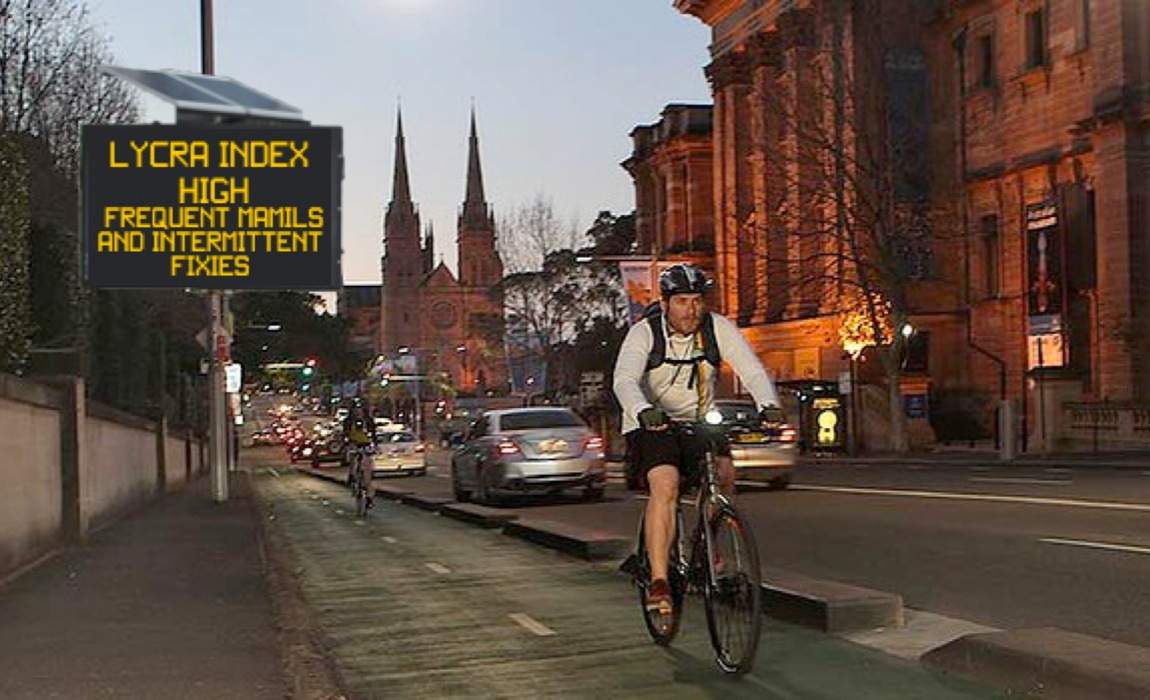
Artists Tega Brain and Gavin Sade used a speed data feed from city cycleways — which output a daily report on how many cyclists go in what direction — combined with the inference that fast cyclists are likely to be harder-core, lycra-clad 'MAMILS' (Middle Aged Men in Lycra). So their plan is to measure this with the Lycra Index. Slow moving cyclists like Sunday riders or families can use the index to work out whether it's a good day set out on the lanes at low speed. MAMILS, conversely, get to see whether it's a good day for a speedy commute into work.

Cycling 365
Brain and Sade's choice to work with cyclists acme sprung from the work of Mitchell Whitelaw, who also tapped into public bike feeds to prototype a tool visualising a year's worth of cycling data in a web browser. The city has magnetic sensors in bike lanes, much like the ones that detect cars at a set of traffic lights. In the troughs of the usage data, Christmas, New Year's and bike festivals start to become obvious.
Race for a Low Number
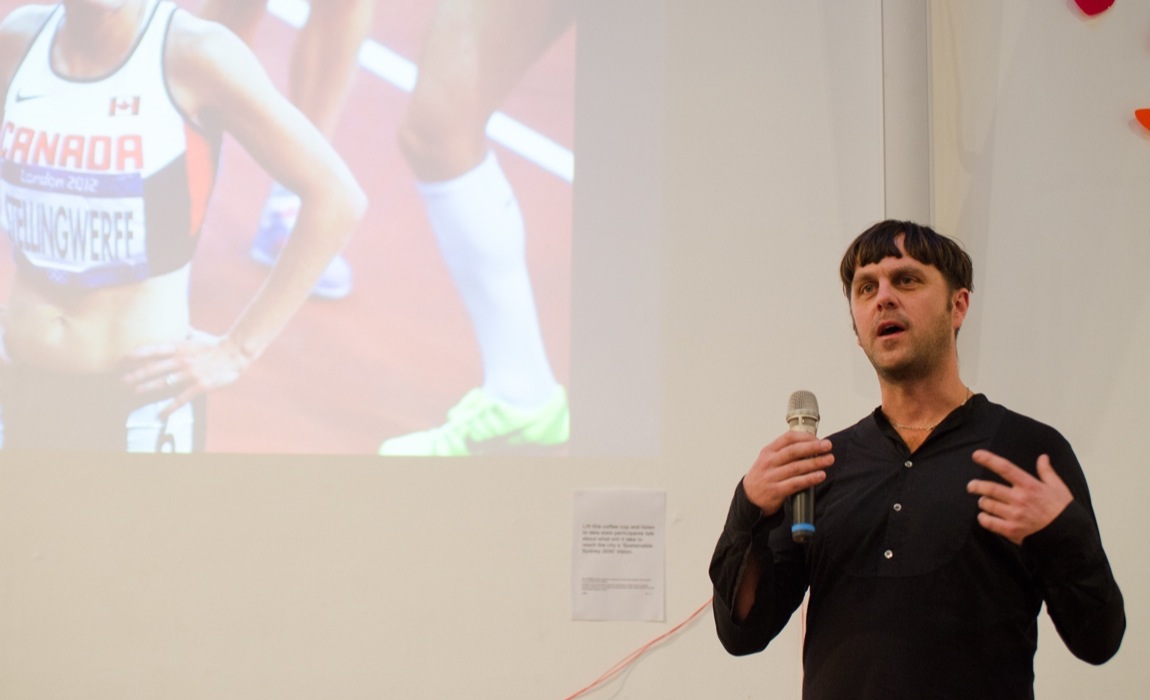
Carbon Arts was also looking to commission an artwork for Art and About that played with City data feeds. The winner of the commission was artist Keith Deverell, who plans to use sport to make some inner-city buildings' environmental footprints more obvious. Six or so screens will be lined up side by side in September. On each, the image of a marathon runner will represent each building's energy usage, drawn from public energy data. Low usage will make these virtual runners run a better race, high usage a poor one. Each runner's image will be assembled live using VJ software, pretty much like a computer voice assembles its artificial sentences out of prerecorded pieces.

Keep Up With the Joneses
Zina Kaye and Mr Snow from Holly were similarly interested in big buildings. Engaging with the problem of modern apartment blocks with no incentive to keep their fancy water recycling systems running efficiently, they proposed a series of lobby indicators, reports and rewards to help residents to both keep up with the Joneses, and stay up to date with how well their building's waste systems are working.

Get Some Data With Your Coffee
Jon McCormack and Greg More worked with data tallying how cafes use energy in different parts of their shop. They split the data into colour-coded graphs picking apart each element of the premises' electrics. From this, they proposed all cafes have coffee cups and outdoor branding colour stamped with their own energy consumption profile. Like shopping for organic, single origin or fair trade coffee, you'd be able to shop for a more efficient caffeine fix.

More Plumbing, Less Hack
Javier Candeira described his idea as more plumbing than hack, per se. Rather than receive data from cities, banks or media, he'll help people broadcast their own sustainability data outward on the wider web. The idea is to upload it to compare your own usage against what other people use living in similar circumstances. Say, in an apartment or in a three-person share house. "Facebook for devices" Xively does this already, but needs special hardware. Candeira's plan is to get all this going with the stuff you have already.

Sucking Up Info from Around Town
Andrea Polli, and fellow members of ISEA guests the Social Media Workgroup, proposed networked sensors called GNOMES (Geo-locative Networked Outdoor Monitoring Environment). These sensors measure ambient environmental conditions, like the energy that can be sucked out of the air around a city via RF (radio waves). By Sunday they've set up a functional recording device using a coffee cup cabled to electronics. Less innocuous than the GNOMES, it records passers-by's ideas on how to make the city more sustainable.
Photos by Lucy Parakhina. Lycra index mock ups by Tega Brain and Gavin Sade, apartment foyer mockup by Zina Kaye and Mr Snow, street interface by Jon McCormack and Greg More, and GNOME by the Social Media Workgroup.


- Dark Arts, Hedonism and Exploration: A Weekender's Guide to Visiting Hobart for Dark Mofo
- The Best Australian Fashion Labels to Know Right Now
- The 12 Best Walks In and Around Sydney
- Sydney's Best Bottomless Brunches
- CP Picks: The Best Gifts for People Who Are Never Home — According to Travel Writers
- The Ten Best Hotels in Brisbane