Here's How You Can Keep an Eye on Australia's National and Statewide Vaccination Rates
Wondering how many people have had the jab in your state or territory, and nationwide? Here's where you can find all the details.
Back in July, Prime Minister Scott Morrison announced that Australia will tie its efforts to manage COVID-19 to vaccination rates moving forward. As the country reaches certain jab milestones — 70 percent of Aussies over the age of 16 receiving two doses, and then 80 percent — the way that Australia handles the pandemic will evolve. Restrictions will start to ease, lockdowns will be less likely, international travel will open back up and people who've been fully vaxxed will live life under loosened rules.
As both New South Wales and Victoria have dealt with COVID-19 outbreaks over the past few months, vaccination rates have continued to be thrust into the spotlight. Both NSW Premier Gladys Berejiklian and her Victorian counterpart Daniel Andrews have highlighted specific jab thresholds, and announced that lockdown rules will begin to change when they're met — at 70-percent fully vaxxed in NSW and 70 percent with at least one dose in Victoria. So, that means that we're all now paying extra attention to those vaccination figures. They're mentioned at each state's daily COVID-19 press conferences, of course, but you can also check out how your state is going and how the nation overall is faring thanks to a heap of online resources.
Wondering why you might be interested in the Aussie rate, and not just vax numbers in your own state or territory? As part of that plan announced by the PM — the National Plan to transition Australia's National COVID Response — vaccination rates have to reach the 70-percent and 80-percent fully jabbed marks across the entire country before an individual state or territory can start easing the rules. That state or territory also has to reach those thresholds itself before it can do anything, of course, but that isn't the only important figure.
This daily infographic provides the total number of vaccine doses administered in Australia 🇦🇺 as of 6 September 2021 📅
💻Stay up to date with COVID-19 vaccine information here: https://t.co/lsM33j9wMW pic.twitter.com/XTydxJH0sK
— Australian Government Department of Health (@healthgovau) September 7, 2021
For Australia-wide data, the Federal Government Department of Health issues several daily reports on the vaccine rollout, complete with handy infographics if you like looking at diagrams more than numerals. You can see the total doses administered, how many people are fully vaccinated, and the breakdown state by state — and, nationwide, also a breakdown of doses by age group and gender. Vax rates among Indigenous Australians, people with disability and the disability workforce, and in residential aged care are also singled out.
Or, there's also the COVID Live website, which collates information on new cases, tests, hospitalisations and vaccinations, and lets you dive further into each. With jabs, it gives a breakdown by state and then by day, and also counts down how many days remain until the country and each state and territory hits 60-percent, 70-percent, 80-percent and 90-percent first doses and fully vaxxed, as based on the seven-day average.
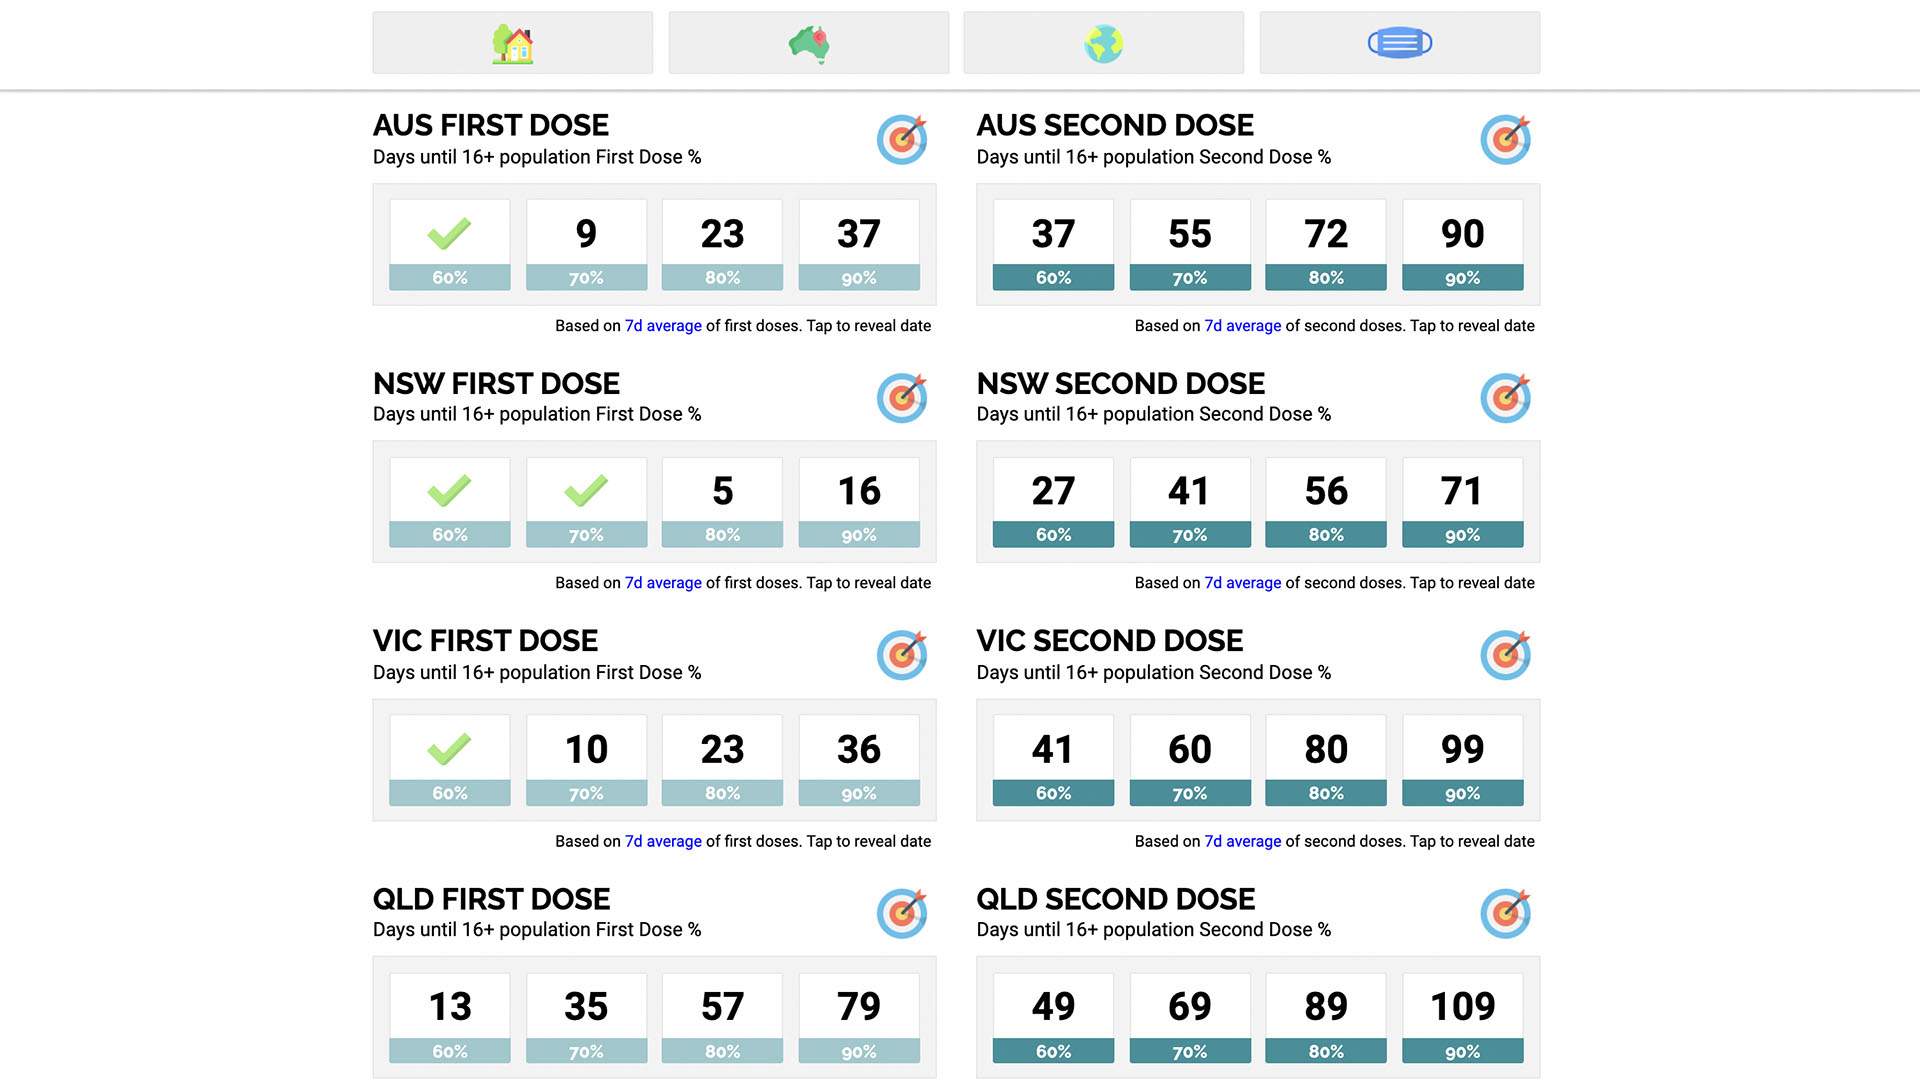
COVID Live as at Wednesday, September 8.
Each state and territory also has its own online resources, with different details on offer depending on the state. In NSW, for instance, you can access a COVID-19 vaccination dashboard that highlights the number of doses that've been given, or you can check out a nifty map that breaks down jabs by postcode and Local Government Area.
Victoria's COVID-19 vaccine data portal lists doses given over the past 24 hours, and also links to a weekly report that tracks the state's progress. Here, you'll find overall and weekly rates, a breakdown via vaccine type and dose — so listing first and second doses of AstraZeneca and of Pfizer — and also breakdowns by age and gender.
For Queensland, the overall stats can be found on Queensland Health's COVID-19 page, with further detail on offer if you click through to its statistics summary. Vaccinations are then listed by vaccine site area, including both overall and hospital/vax hub-specific figures. You can see how many doses were administered the day prior and in total so far.
Queensland #COVID19 update 7/09/21
Today we have recorded 0 new cases of COVID-19.
Detailed information about COVID-19 cases in Queensland, can be found here: https://t.co/kapyXpSIAP pic.twitter.com/G4J57unlPc
— Queensland Health (@qldhealthnews) September 7, 2021
In Western Australia, there's a vaccination dashboard filled with infographics about doses, rates and age breakdowns. In South Australia, you'll find an overall daily vaccination figure on the state's overall COVID-19 dashboard.
Tasmania has a statistics section on the government's COVID-19 website, and includes both a cumulative tally and the daily increase — and both the Australian Capital Territory and the Northern Territory have their own COVID-19 dashboards with relevant figures.
To find out more about the status of COVID-19 in Australia and how to protect yourself, head to the Australian Government Department of Health's website.


